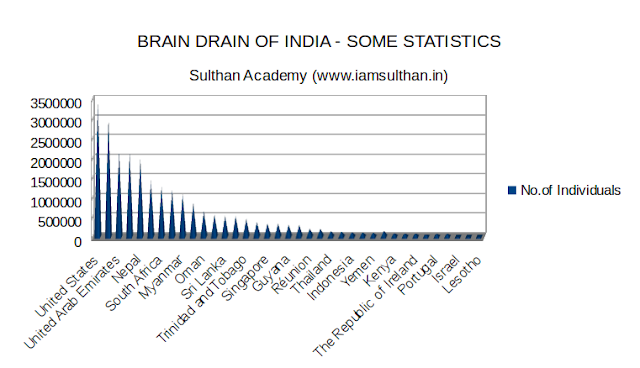
Today,I present some of the key statistics that draws attention and bring alarm bells to India. Among Asian countries, India continues its trend of top the list of immigrant scientists and engineers to the US, says the latest report, adding that with 950000 Indians out of Asia's total of 2.96 million, this report of 2013 represented an 85 percent increase from 2003. Overall, the number of immigrant scientists and engineers in the US has risen to 18 percent from an earlier 16 percent and 57 percent of those were born in Asia. From 2003 to 2013, the number of scientists and engineers residing in the US rose from 21.6 million to 29 million. This 10-year increase included significant growth in the number of immigrant scientists and engineers, from 3.4 million to 5.2 million, said the report from the National Science Foundation's National Centre for Science and Engineering Statistics (NCSES). In 2013, 63 percent of US immigrant scientists and engineers have naturalized citizens, while 22 percent were permanent residents and 15 percent were temporary visa holders. Also, the human capital is not only a major problem in India, It is also a key problem for many Asian other countries. Since 2003, the number of scientists and engineers from the Philippines increased 53 percent and the number from China, including Hong Kong and Macau, increased 34 percent, the report added. The NCSES report found that immigrant scientists and engineers were more likely to have earned post-baccalaureate degrees than their US-born counterparts. In 2013, 32 percent of immigrant scientists reported their highest degree was a master's (compared to 29 percent of US-born counterparts) and 9 percent reported it was a doctorate (compared to 4 percent of US-born counterparts).The most common fields of study for immigrant scientist and engineers in 2013 were engineering, computer and mathematical sciences and social and related sciences, the findings showed. Over 80 percent of immigrant scientists and engineers were employed in 2013, the same percentage as their US-born counterparts. Among the immigrants in the science and engineering workforce, the largest share (18 percent) worked in computer and mathematical sciences, while the second-largest share (eight per cent) worked in engineering. Three occupations - life scientist, computer, and mathematics scientist and social and related scientist saw substantial immigrant employment growth from 2003 to 2013, the report said.
The
following table visualizes the significant number of Indian
individuals that resides in each country.
Country
|
No.of
Individuals
|
| United States |
3443063
|
| Saudi Arabia |
3000000
|
| United Arab Emirates |
2200000
|
| Malaysia |
2150000
|
| Nepal |
2000000
|
| United Kingdom |
1451862
|
| South Africa |
1286930
|
| Canada |
1214110
|
| Myanmar |
1100000
|
| Mauritius |
882220
|
| Oman |
670000
|
| Kuwait |
579390
|
| Sri Lanka |
551500
|
| Qatar |
545000
|
| Trinidad and Tobago |
468500
|
| Australia |
390894
|
| Singapore |
351700
|
| Bahrain |
350000
|
| Guyana |
320200
|
| Fiji |
313798
|
| Réunion |
220000
|
| Netherlands |
215000
|
| Thailand |
150000
|
| Suriname |
140300
|
| Indonesia |
125000
|
| Italy |
120000
|
| Yemen |
111000
|
| New Zealand |
160000
|
| Kenya |
100000
|
| Tanzania |
92000
|
| The Republic of Ireland |
91520
|
| France |
65000
|
| Portugal |
80000
|
| Germany |
86000
|
| Israel |
7000
|
| Colombia |
4000
|
| Lesotho |
4000
|

